How Much Do Solar Companies Make Per Sale: A Comprehensive Breakdown
Understanding the financial dynamics of solar power system sales is crucial for both sales professionals and companies. This guide explores the commission structure, earning potential, and various factors influencing the profitability of solar sales.
Commission Structure in Solar Sales
Solar sales commissions are typically structured as a combination of base commissions, volume bonuses, and incentives for self-generated leads. Here’s a detailed breakdown:
- 5% Base Commission: This is the standard commission rate applied to the net revenue.
- 2% Volume Bonus: Awarded for meeting sales targets within a specific period (monthly or quarterly).
- 2% Self-Generated Lead Bonus: Additional commission for leads generated by the salesperson through methods like canvassing.
Example Calculation:
Let’s consider a sales rep selling a 9 kW system at $3.25 per watt:
- Total Sale Price: 9,000 watts x $3.25 = $29,250
- Net Revenue (after 7% dealer finance fee): $29,250 x (100% – 7%) = $27,203
Potential commissions:
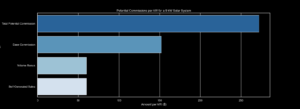
- Base Commission (5%): $27,203 x 5% = $1,360
- Volume Bonus (2%): $27,203 x 2% = $544
- Self-Generated Sales (2%): $27,203 x 2% = $544
Total Potential Commission: $2,448
Commission per kW:

- Base Commission: $152 per kW
- Volume Bonus: $60 per kW
- Self-Generated Sales: $60 per kW
- Total Potential Commission: $272 per kW
Factors Influencing Earnings
Monthly/Quarterly Targets: Volume bonuses depend on achieving sales targets, measured either in kW sold or contracts signed.
Net Revenue Basis: Commissions are calculated on net revenue, which is the contract price minus dealer finance fees.
Chargebacks: Sales reps may face chargebacks for price reductions or additional unpriced services.
Payment Schedules: Payments vary widely, with some companies paying nothing at contract signing and others up to 50%.
Fair Compensation: A fair schedule pays salespeople proportionally with lender disbursements, aligning earnings with company cash flow.
Earning Potential for Solar Salespersons
Average Salesperson:
- Annual Earnings: ~$65,000
- Deals per Month: ~3
- Closing Rate: 13% (1 out of 6 to 8 presentations)
Top 10% Salesperson:
- Annual Earnings: ~$120,000
- Deals per Month: ~4.5
- Closing Rate: 20% (1 out of 5 presentations)
Top Salesperson:
- Annual Earnings: ~$220,000
- Deals per Month: ~8
- Closing Rate: 33% (1 out of 3 presentations)
- Lead Generation: All leads are self-generated.
Market Dynamics and Strategies
Local vs. Big Three Companies:
- Working for local contractors often yields higher earnings due to lower prices and better sales volume.
- Big companies like Tesla/SolarCity, Vivint, and SunRun may pay less but offer brand recognition and resources.
Lead Quality:
- Telemarketing leads tend to have lower closing ratios compared to inbound or canvassed leads.
Commission Rates and Market Competitiveness:
- Fair market-priced systems typically pay less than $300 per installed kW in commissions.
- Higher commission rates may indicate overcharging or unsustainable business models.
Solar commissions market trends
The solar energy market has been experiencing significant growth, driven by a combination of technological advancements, policy incentives, and increasing environmental awareness. Below, we explore the key trends shaping the solar sales market.

1. Rising Demand for Solar Energy
📈 Increasing Installations:
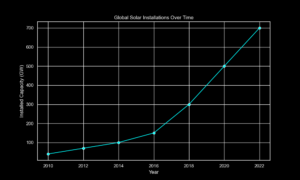
- The global capacity for solar installations has been growing rapidly. According to the International Energy Agency (IEA), solar power is set to account for almost 60% of the global increase in renewable energy capacity in 2021.
🌍 Regional Growth:
- The largest markets include the United States, China, and the European Union, each with strong policy support and substantial investments in solar infrastructure.
2. Technological Advancements
🔧 Improved Efficiency:
- Technological improvements in photovoltaic (PV) panels have led to higher efficiency rates, making solar power more competitive with traditional energy sources.
🔋 Energy Storage Integration:
- The integration of battery storage solutions with solar systems allows for better energy management and increased self-consumption, enhancing the value proposition for customers.
3. Policy and Incentives
🏛️ Government Support:
- Various governments have implemented policies and incentives to promote solar energy adoption. These include tax credits, rebates, and net metering policies. In the U.S., the federal solar Investment Tax Credit (ITC) has been a significant driver.
⚖️ Regulatory Changes:
- Some regions are revising their net metering policies, impacting how solar users are compensated for excess power they supply to the grid. Keeping abreast of these changes is crucial for sales strategies.
4. Cost Reductions
💰 Declining Costs:
- The cost of solar PV panels has decreased significantly over the past decade. Economies of scale, improved manufacturing processes, and increased competition have all contributed to this trend.
🛠️ Installation Costs:
- Installation and balance of system (BOS) costs have also fallen, making solar energy more accessible to a broader customer base.
5. Consumer Awareness and Demand
🔆 Environmental Concerns:
- Increasing awareness of climate change and environmental sustainability is driving more consumers and businesses to adopt solar energy as a clean power source.
📊 Financial Savings:
- Beyond environmental benefits, many consumers are motivated by the potential for long-term financial savings on their energy bills.
6. Sales and Marketing Strategies
📈 Data-Driven Approaches:
- Solar companies are leveraging data analytics to target potential customers more effectively and optimize their sales processes.
💼 Professional Sales Teams:
- The role of well-trained, professional sales teams is becoming increasingly important. Effective sales strategies, including personalized customer engagement and clear communication of benefits, are key to closing deals.
7. Challenges and Opportunities
🛠️ Supply Chain Issues:
- The solar industry faces challenges such as supply chain disruptions and the availability of raw materials, which can impact production and costs.
💡 Innovation Opportunities:
- There are opportunities for innovation in areas like flexible and lightweight PV panels, which can be used in new applications and environments.
Conclusion
Solar sales commissions are a mix of base, volume, and self-generated lead bonuses, calculated on net revenue. Salespeople can earn from $65,000 to $220,000 annually, depending on their sales performance and lead generation methods. Working for reputable local contractors often results in higher earnings due to competitive pricing and higher sales volumes. Understanding these dynamics is key to maximizing earnings and achieving success in the solar industry.
